 |
Science 122Laboratory |
 |
|
Science 122Laboratory |
|
1.1. Make the proper choice of graph paper\
1.2. Use a pen or a sharp pencil.
1.3. Write neatly and legibly.
1.4. Choose scales for both axes so that the graph spans as much as possible of the graph paper being used.
1.5. Choose scales for the x and y axes that are easy to read and plot.
1.6. Plot the independent variable on the horizontal or x axis and the dependent variable on the vertical or y axis.
1.7. The two quantities (circumference and diameter) plotted for this experiment are called variables. For the data given, the diameter of the circle is the independent variable and the circumference ;the dependent
1.8. Plot each ordered pair of numbers as a single point.
1.9. Plot each point clearly using a dot surrounded by a small circle
1.9.1. Label the x and y axes with the quantity plotted. Examples: distance, time, area, volume, etc.
1.9.2. State the units of each quantity plotted. Examples: centimeters, seconds, cm2, cm3, etc.1.10. Use a ruler to draw a smooth, straight line which comes closest to touching all of the points. If a straight line does not "fit" the points then draw a smooth line or curve which connects the points. "Smooth" suggests that the line does not have to pass exactly through each point but connects the general areas of significance.Look here to see an example of a "best fit" graph.
1.11. Give the graph a title and place the title on the graph (usually upper center of graph). The name of the graph is taken from the labels of the x and y axes plus reference to the object to which the data refer. Examples: volume versus radius for a sphere; period versus length for a simple pendulum.
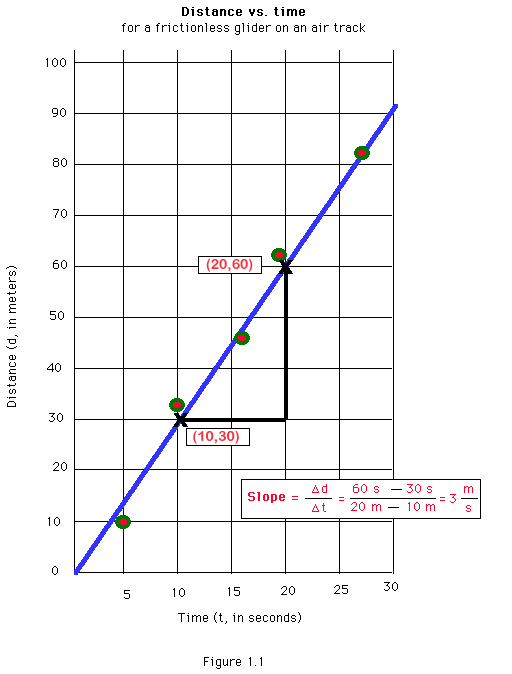
1.12. Place your name and the date on the graph (usually lower right side of graph).Use Fig. 1.1 for an example of a graph plotted according to the above instructions. Note that the line does not pass through all of the points. It is a best fit line.
![]()
NOTE that the line does not simply connect the points. It is a "best fit" straight line. |
The slope of a curve (for this graph the "curve" is a straight line)
is defined as the change in the "y" or vertical values divided by the change
in the "x" or horizontal values. This can be stated in symbol notation
as ![]() . Read this
as "Delta y over Delta x" ("
. Read this
as "Delta y over Delta x" ("![]() " means "change in" or "difference
in"). Using m as the symbol for the slope definea the slope like this:
" means "change in" or "difference
in"). Using m as the symbol for the slope definea the slope like this:
Think of the slope as a number which indicates the "steepness" of the line on the graph. An equivalent term is "rise over run":

Slope equals rise divided by run. It is a measure of how much forward motion is required to reach a certain height. The less run for a given rise, the steeper the slope, and the larger the number which represents it.
On our graph the rise is the difference between any two "y" values,
or the change in y. We write this as ![]() y and calculate it by taking the difference between the
y coordinates of two points on the line, or y2 - y1.
y and calculate it by taking the difference between the
y coordinates of two points on the line, or y2 - y1.
The run is the difference between any two "x" values, or the change
in x. We write this as ![]() x and calculate it by taking the difference between the x coordinates
of two points on the line, or x2 - x1.
x and calculate it by taking the difference between the x coordinates
of two points on the line, or x2 - x1.
We call the slope "m". Why "m"? Why not? What would you call it?
5.4.1. Be careful here. Do not mistakenly assume that the line or curve must pass through the origin. In many cases it will, but not always.
5.4.2 Note that "y" and "x" are general terms to indicate the quantity plotted on the vertical axis (dependent variable) and the horizontal axis (independent variable).
Read this as : for each ordered pair (x,y) the second (y) value is some number "m" multiplied by the first value (x). The number, which is represented by the slope of the line is called a constant of proportion. Equivalently: the value plotted on the vertical axis is the slope of the line multiplied by the valued plotted on the horizontal axis. This is the general relationship for a straight line that passes through the origin.
In the relationship above, when x is zero, y is zero. Thus the curve crosses the y axis at the origin (the point (0,0) and so the y-intercept is "zero". Later we will see curves that do not pass through the origin, and the y-intercept will have a numerical value.